
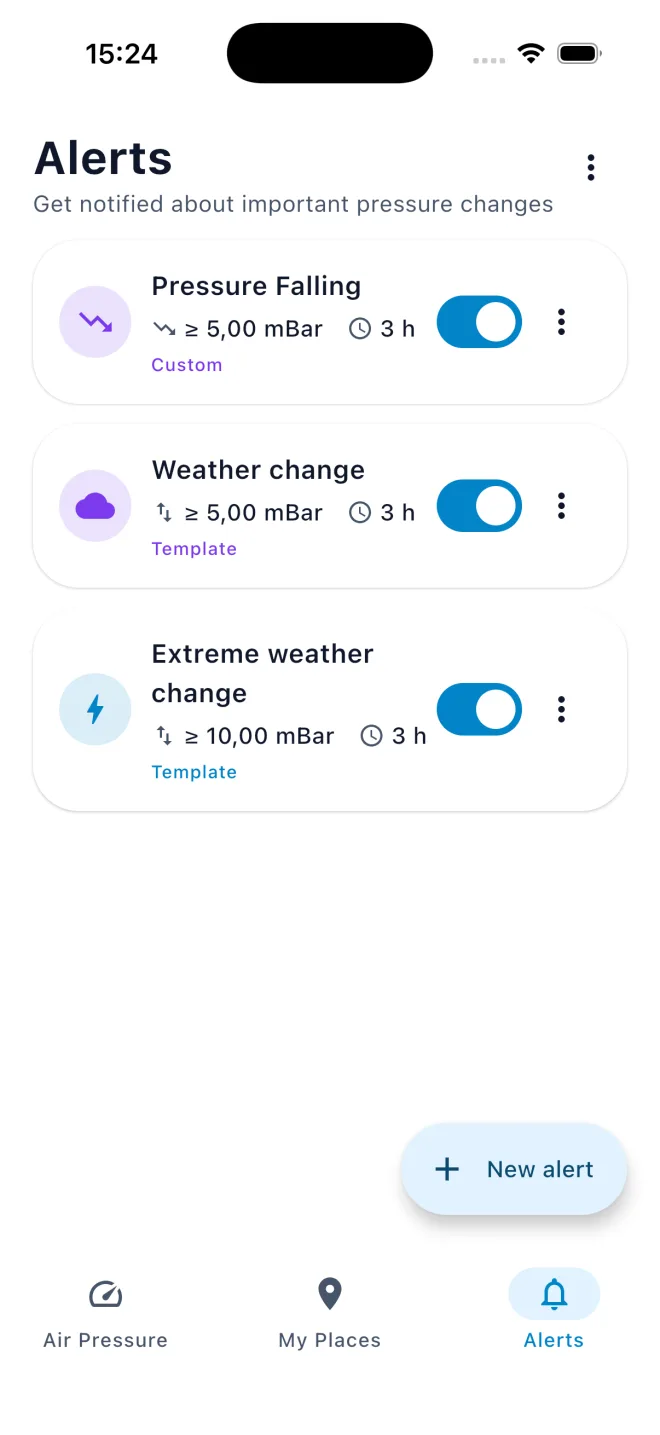
Gauge and trend
The current pressure on a dial, plus a plain-language trend: rising, falling or steady, with the exact change over the last three hours.
Barometer Reborn reads the barometer in your phone, keeps the history, separates it by place, and notifies you when the pressure moves.
Free to use, with an optional one-time Platinum purchase. No subscription.
Measured, not guessed
On a phone with a barometer, every reading comes from that sensor and is stored on the device.
A decade of history
On Google Play since 2016, rated 4.6, and rebuilt from the ground up for modern Android and iOS.
Works without a barometer
Phones with no pressure sensor get the same screens, with data fetched for their location instead.
Features
Air Pressure, My Places and Alerts. The current value and the trend are one glance away; the detail is one tap away.
The current pressure on a dial, plus a plain-language trend: rising, falling or steady, with the exact change over the last three hours.
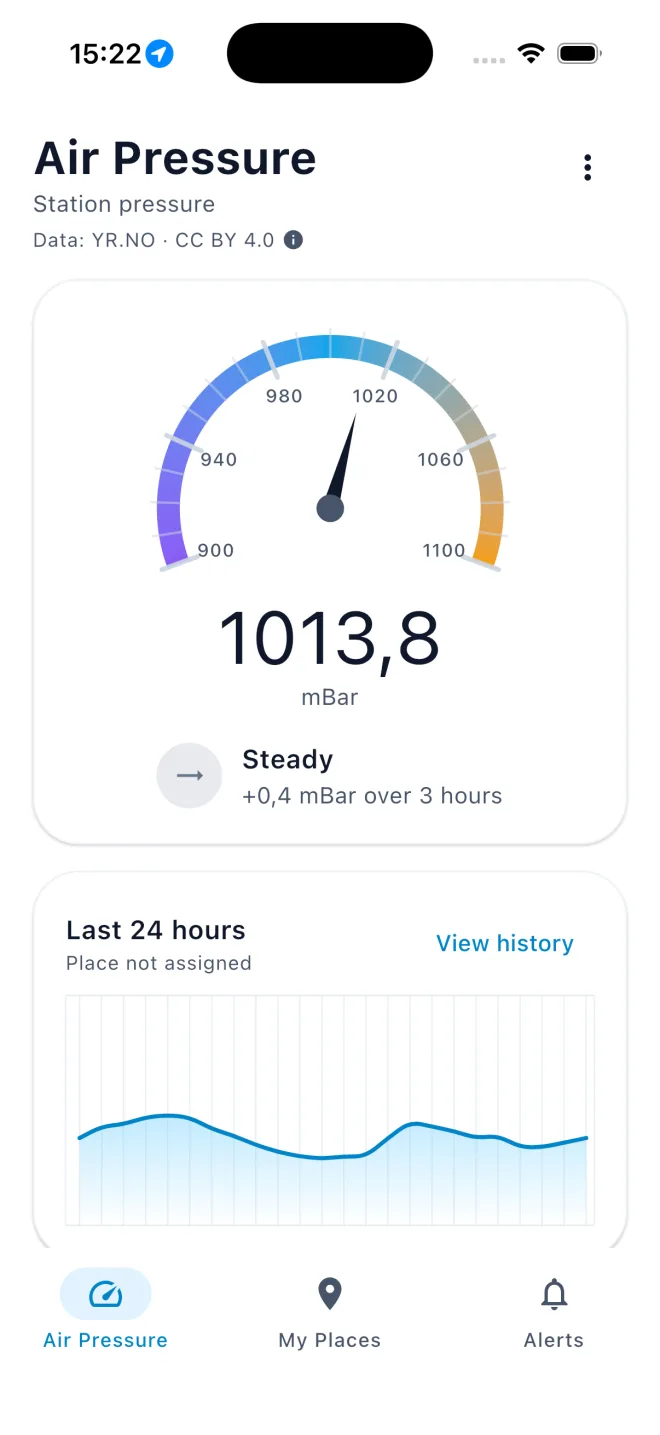
Chart the last 24 hours, 3 days, 7 days or 30 days, with minimum, maximum, average and total change for the window you picked.
Home, work, the cottage — each place gets its own chart, so a trip does not put a mountain pass in the middle of your home readings.
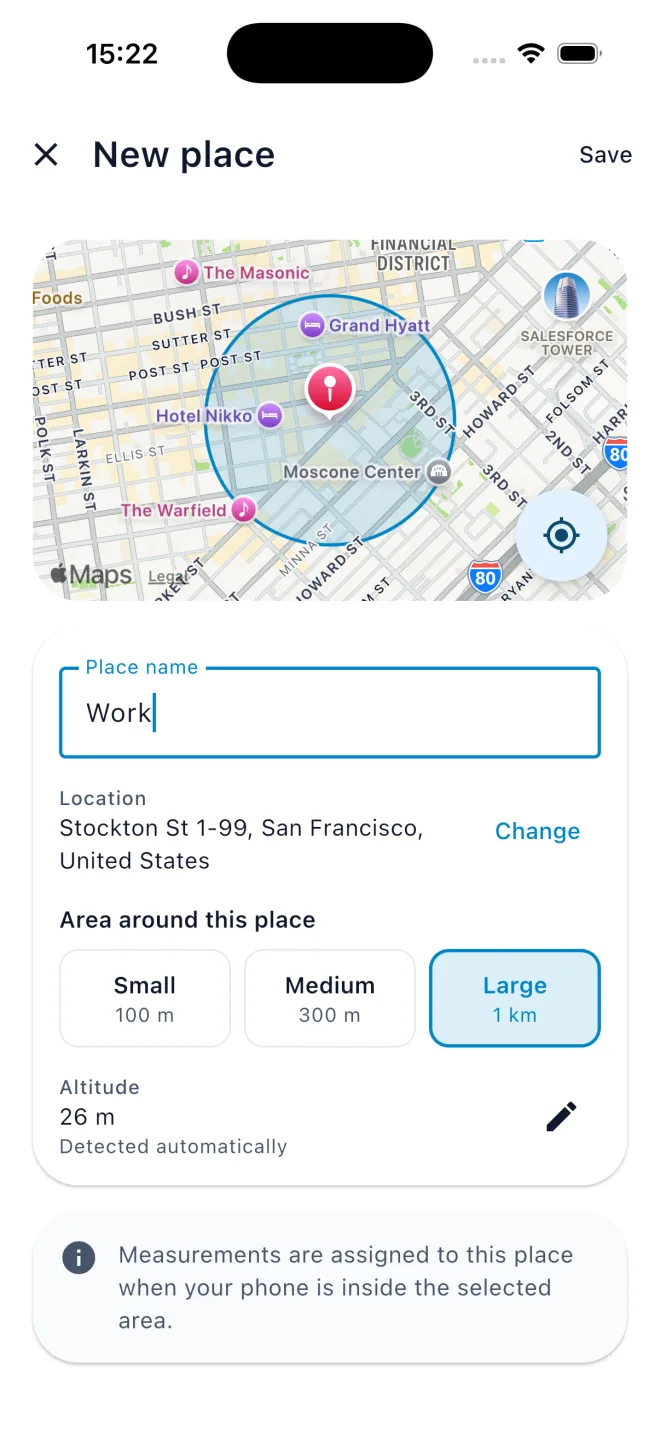
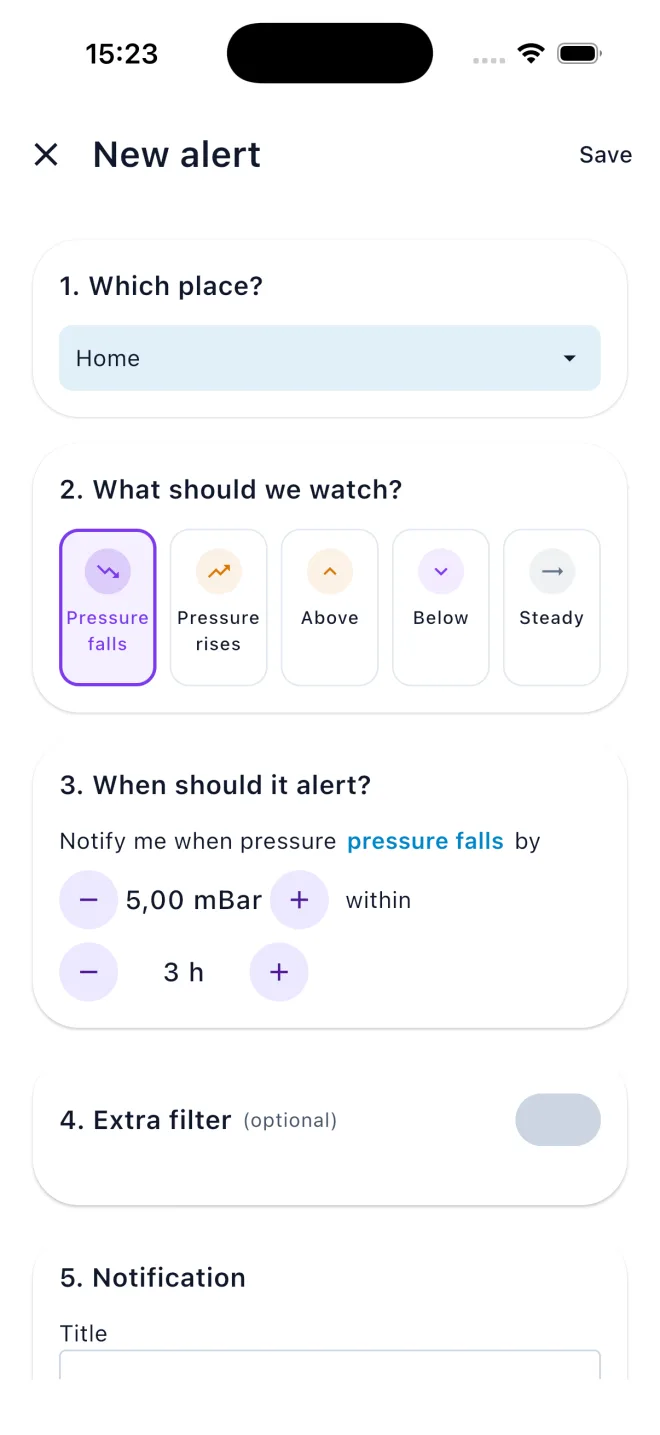
Two ready-made rules for weather changes, or a custom one: pick the direction, the amount and the time window, and write the notification yourself.
On Android, a home screen widget with the current value or a mini chart, and a status bar notification that keeps the pressure in the shade.
mBar, hPa, inHg, torr or mmHg. Optional conversion to mean sea level pressure on phones with a barometer; the weather service already supplies sea level values. Readings exportable as CSV.
History
A single value is rarely the interesting part. The history screen puts the chart, the numbers and the raw measurements on one page, filtered by place and time window.
My Places
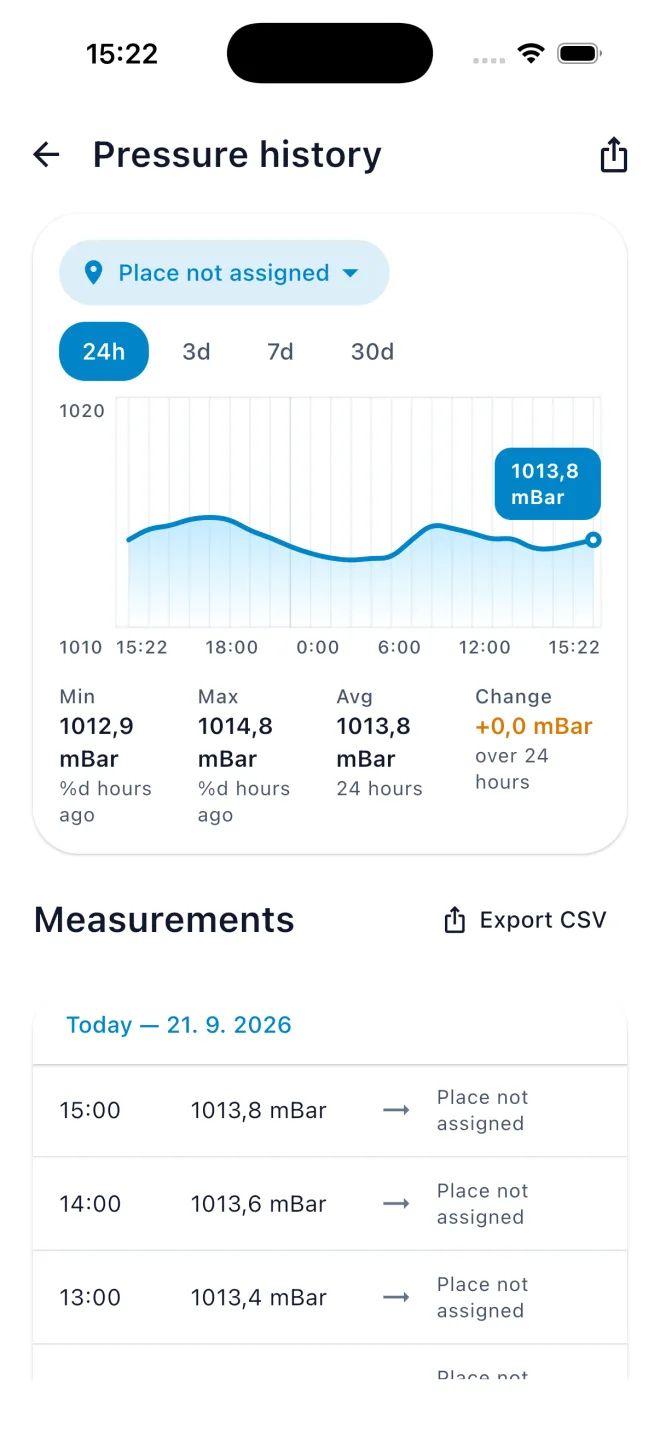
Pick a spot on the map, name it, choose how large the area around it is, and the app keeps that place's readings separate. Altitude is detected automatically, which is what sea level conversion needs.
On a phone with a barometer, a place collects data while you are physically inside its area. Without a barometer, every place is fetched for you, wherever you happen to be.
Alerts
Two ready-made rules cover the common cases. The custom editor walks through five short steps and shows the notification you will actually receive.
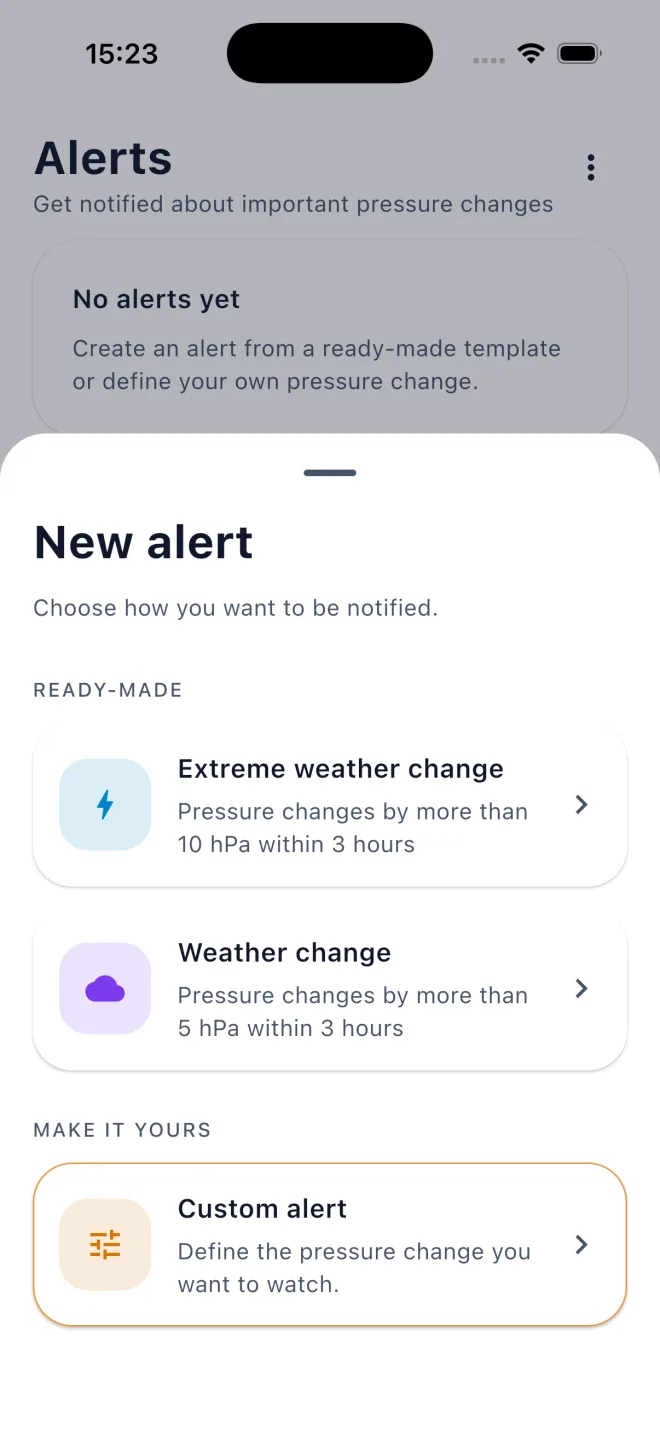
Pressure changes by more than 10 hPa within 3 hours.
Pressure changes by more than 5 hPa within 3 hours.
Falls, rises, goes above, goes below or stays steady — your threshold, your window, your wording.
On a phone with a barometer the rules are evaluated on the device, so nothing about them ever leaves it. Without a barometer they are evaluated on the server and arrive as a push notification.
Platforms
Not every phone has a barometer. Where the sensor is missing, the app fetches the pressure for your location from a weather service instead — the screens are the same, but a few things behave differently. This is the honest version.
| Feature | Android with barometer | Android without barometer | iOS (coming soon) |
|---|---|---|---|
| Where the data comes from | The phone's own sensor | A weather service, for your location | A weather service, for your location |
| Works with no internet connection | Yes | No | No |
| Location permission required | Yes — “while using the app” | Yes — “while using the app” | Yes — “while using the app” |
| Measurement interval | Every 15 minutes, measured by your phone | Set by the weather service, refreshed as its data updates | Set by the weather service, refreshed as its data updates |
| Background collection | Yes, after you allow it | Done for you by the service | Done for you by the service |
| Where the history is stored | On the device only | On the server, per location | On the server, per location |
| My Places | Collects while you are inside the area | Every place is fetched, wherever you are | Every place is fetched, wherever you are |
| Alerts fire | Yes, evaluated on the device | Yes, evaluated on the server, delivered as a notification | Yes, evaluated on the server, delivered as a notification |
| Home screen widget | Yes | Yes | Not yet |
| Status bar notification with the current value | Yes | Yes | Not applicable on iOS |
| History, statistics and CSV export | Yes | Yes | Yes |
| Units (mBar, hPa, inHg, torr, mmHg) | Yes | Yes | Yes |
| Station or sea level pressure | Either — station pressure, or converted to sea level using the altitude of your place | Sea level pressure, as supplied by the weather service | Sea level pressure, as supplied by the weather service |
| Data source credit shown in the app | Not needed — you measured it | Yes, provider and licence | Yes, provider and licence |
| Availability | Google Play, since 2016 | New in 2026 | Coming soon |
Not sure which one you have? Install the app and open it. It detects the sensor on the first run and picks the right mode by itself — there is nothing to configure. Which phones have a barometer?
Older versions were sensor-only. Before this rewrite the app simply did not work on a phone without a barometer. That restriction is gone.
Why track pressure
Everyone else looks at it when a storm is coming. These two look at it because the number changes what their day is like.
Migraine, headaches, sinuses, old injuries, joints. The research is not a folk tale: studies of migraine sufferers find attacks clustering when pressure has dropped, with commonly reported sensitivity somewhere around 5 to 10 hPa, and a large study of emergency department headache visits found lower pressure in the preceding days raised short-term risk.
What matters is the rate of the fall, not the absolute number — the same 6 hPa over six hours is a different event from 6 hPa over three days. That is exactly what an alert rule measures: an amount, inside a time window.
The two ready-made rules
Weather change watches for more than 5 hPa in 3 hours. Extreme weather change watches for more than 10 hPa in 3 hours. If your own threshold sits elsewhere, a custom rule takes any amount and any window.
The app records pressure and notifies you about changes you asked about. It is not a medical device, it does not diagnose anything, and everyone’s threshold is their own — which is why the history and the CSV export matter: a few weeks of your data next to your own notes tells you more than any average.
Barometric pressure and headaches →Anglers have read barometers for a century, and the pattern they describe is consistent: a sharp fall ahead of an approaching front is the classic feeding window — fish move and feed hard before the front arrives. Once the front is overhead and the pressure is low and unsettled, the bite usually shuts down.
After that comes the other half of the rule: while the barometer is still moving, fish are adjusting and fishing is slow. Once it settles, whether high or low, the next couple of days tend to fish well. A rising barometer right after a front is the classic slow morning.
How to set it up
Pressure is a signpost rather than a cause — it moves together with light, wind and temperature, which is why it predicts the fishing so well. The app gives you the signpost and the history to check it against.
Barometric pressure and fishing →A sharp fall usually precedes a change. The app shows the change; it does not pretend to forecast.
Hikers, pilots and divers read pressure trends as a matter of routine. A history per place beats one number.
Plenty of people simply like watching a real measurement their own phone took, over months.
Manual
Setup, the three tabs, places, alert rules, widgets, units, background monitoring and troubleshooting.
Read the manual →FAQ
Sensors, accuracy, sea level pressure, battery use, privacy, purchases and what happens when you travel.
Read the FAQ →More apps
A small family of utilities built around precise information and long-term support.
A live battery gauge with charge time, temperature, voltage and smart predictions.
The classic Android battery widget with a status bar indicator and detailed battery information.

A world clock and widget for keeping important time zones visible at a glance.

Precise time tools for checking clock accuracy and measuring watch performance.